When the Pattern Changes: What Cancer Images Can—and Can’t—Tell Us
By Paul Samuel Guarino
A tissue has an architecture. Cancer can disrupt it. Can we measure that change in a useful way?
That is the question behind my cancer research.
Researchers have been measuring cellular shape and texture for decades. My work explores a particular hypothesis: that changes in biological organization may be readable through a defined set of spatial and spectral measurements, and that some of those measurements may carry useful information across different cancer datasets.
The results include measurable differences, substantial overlap, and exceptions that sharpen the question.
Here is what the data says—and what I want to test next.
Who am I to ask this?
I’m an independent researcher out on Long Island. No lab. No institution. No grant.
What I have is a hypothesis, public datasets, and the patience to check the calculations against the source material.
The work sits within my SEIS-UGFM coherence framework. Here, coherence refers to aspects of organization measured through image structure: how brightness varies, how texture is distributed, and how much variation appears at different spatial scales.
The proposed connection to critical-transition research is whether changes in spatial variability and spectral structure could provide early warning of a shift in cellular state. Establishing that role requires the planned time-course experiment.
The report brings together six public datasets addressing several cancer-related questions. Its evidence record includes analyses audited on October 3, 2026, preserved earlier runs, and extensions completed on October 22 and 23. Each result has its own history; they were not all produced or rerun on the same day.
Reproducing a calculation is an essential check. Independent replication and biological validation are further steps.
What the analyses found
In a small, 100-record morphometric dataset, perimeter alone separated the supplied malignant and benign labels at AUC 0.895.
A separate analysis of 97 prostate patients used log cancer volume, log prostate weight, and seminal vesicle invasion to model log PSA, with a reported R² of 0.636. That is an association among clinical measurements. It does not by itself establish a coherence mechanism.
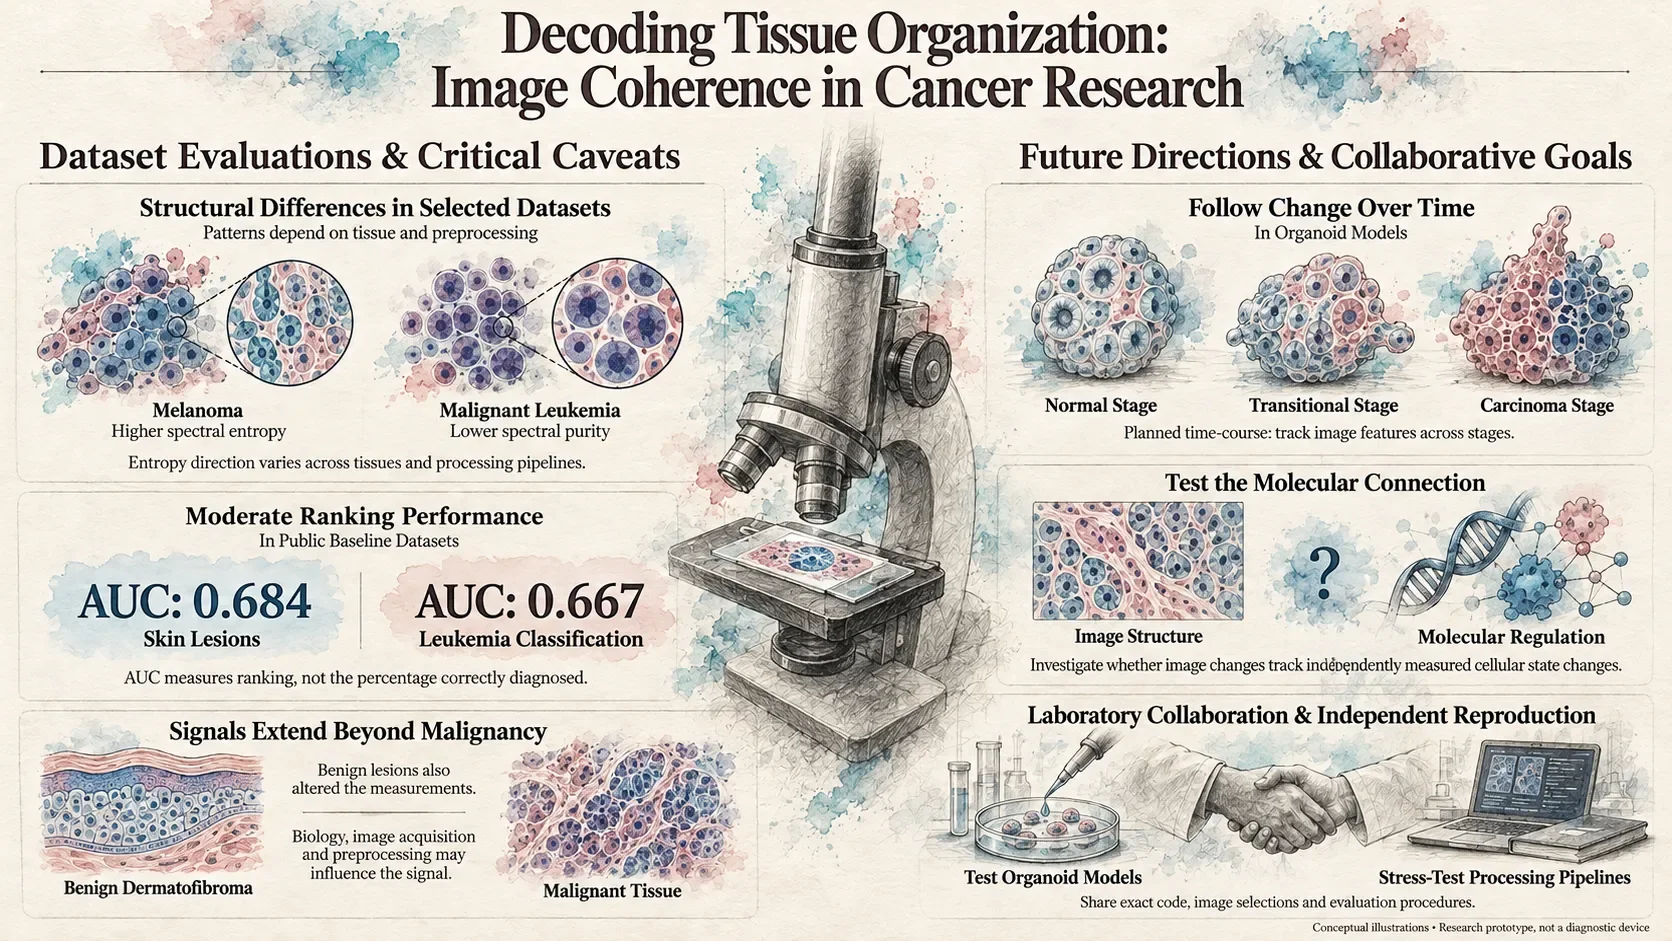
The skin-lesion analysis was particularly interesting. In the original comparison of 1,113 melanoma images and 1,500 nevus images, melanoma images were, on average, dimmer, more variable in brightness, lower in the defined brightness-to-spread measures, and higher in spectral entropy.
Those shifts matched the proposed directions. Some of these measures are mathematically related, so they should not be counted as four independent confirmations. The combined model reached AUC 0.684.
In 1,867 leukemia and normal-cell images, spectral purity was lower in the malignant group. The combined feature model reached AUC 0.667, while several individual measures offered little separation.
The 4,000-patch histopathology analysis found small differences across six metrics. The ovarian work addressed a separate problem—distinguishing cancer subtypes—with a best reported three-class balanced accuracy of 0.611 ± 0.079.
AUC describes how well a score ranks two groups; 0.5 represents chance-level ranking and 1.0 perfect separation. It is not the percentage of patients correctly diagnosed.
The distributions overlap, the tasks differ, and the measurements do not all move in one direction. Spectral entropy, for example, was higher in the original melanoma comparison but lower in the histopathology comparison.
That makes the next question more specific: which aspects of organization are we measuring, under which conditions, and what do they tell us about the biology?
Where KAIST enters the picture
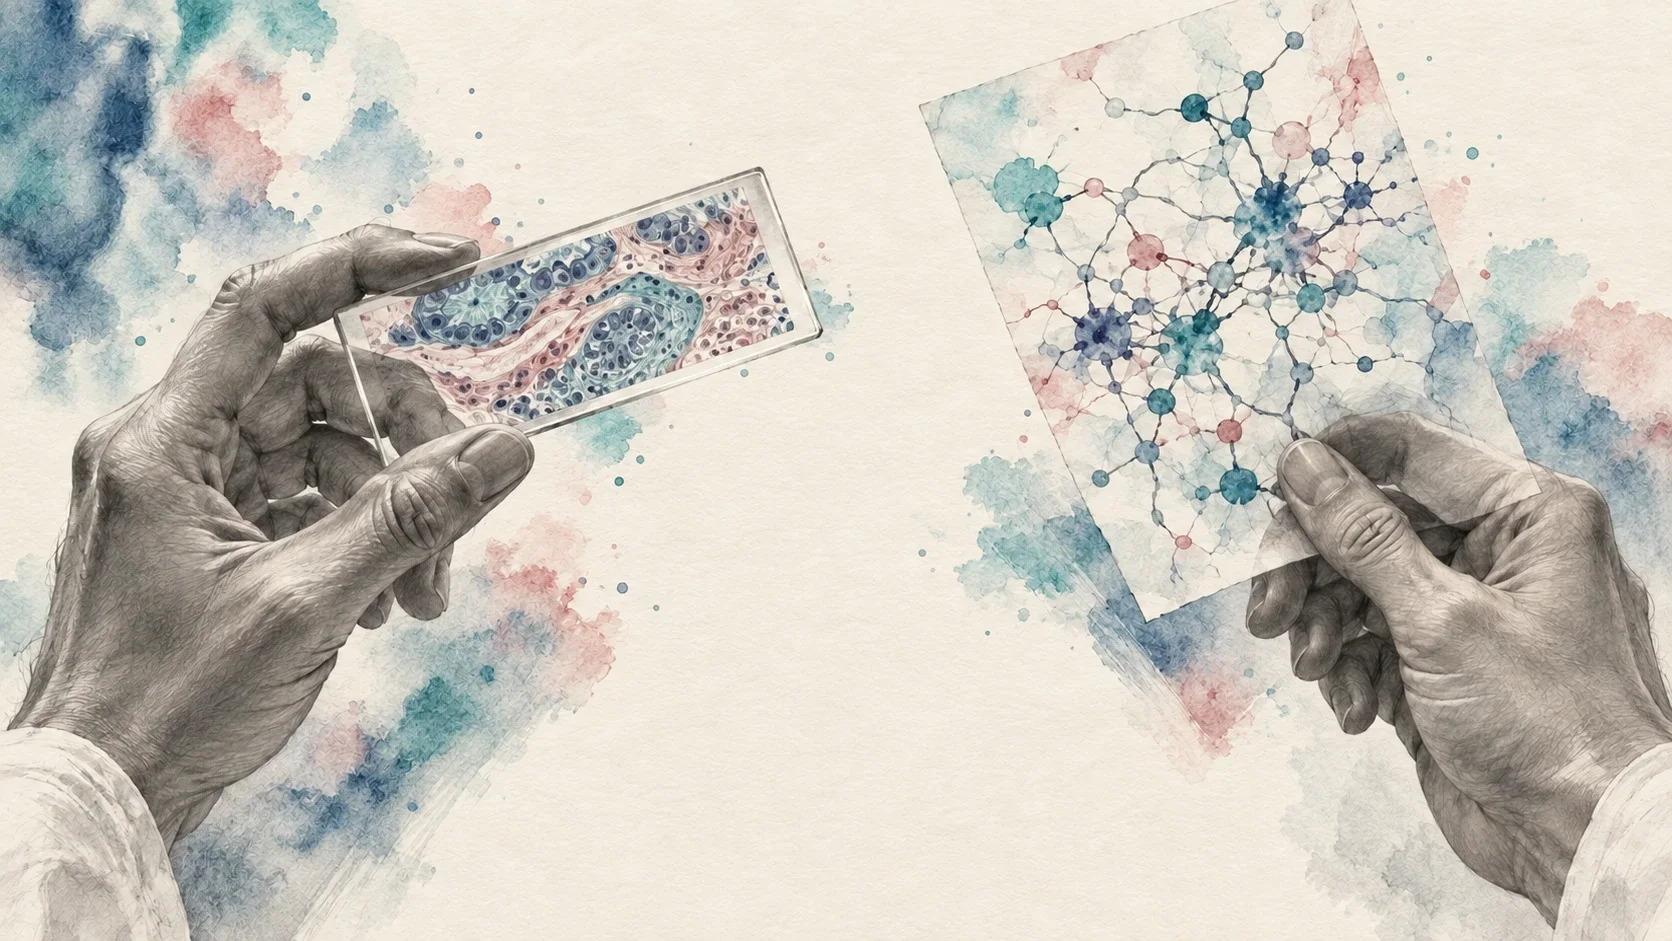
A KAIST-led study first published online in January 2025 introduced REVERT, a framework that models gene-regulatory networks and transitions between normal and cancer-associated cell states.
The researchers tested USP7 inhibition in patient-derived colorectal-cancer organoids. They observed reduced growth and gene-expression changes toward a more normal colon state.
That is an experimental finding within the system they studied. It does not establish complete restoration of healthy tissue or a treatment for patients.
It raises a question relevant to my work: could image-based measurements track changes in cellular state during an intervention like this?
Their study did not test my metrics, reproduce my results, or investigate the 41.176 Hz hypothesis. The relationship between their molecular findings and my image measurements remains a proposed connection.
Testing that connection is part of the work I want to pursue.

What the exceptions taught me
A benign dermatofibroma also differed substantially from nevi in the broader skin-lesion analysis.
That result belongs in the report. It shows that a feature can distinguish appearances without identifying malignancy specifically. It does not establish that malignancy is the largest cause of the measured differences.
Some measurement directions also changed between the original processing method and the resized browser implementation. The interpretation has to account for tissue type, image acquisition, preprocessing, and biological variation.
The browser-based research prototype now has an image channel that computes measurements from uploaded images. It displays its calibration information and labels the simulated bioelectric and biophoton channels SIMULATED.
Its separate calibration runs reported cross-validated AUCs of 0.727 on 1,007 HAM10000 images and 0.806 on 400 C-NMC images. Those are subsample results from a different processing pipeline. A controlled comparison on the same held-out material is needed before calling them an improvement.
Transparency belongs in the instrument itself.
What happens next
The question that interests me most is whether these measurements change during a biological transition—and when.
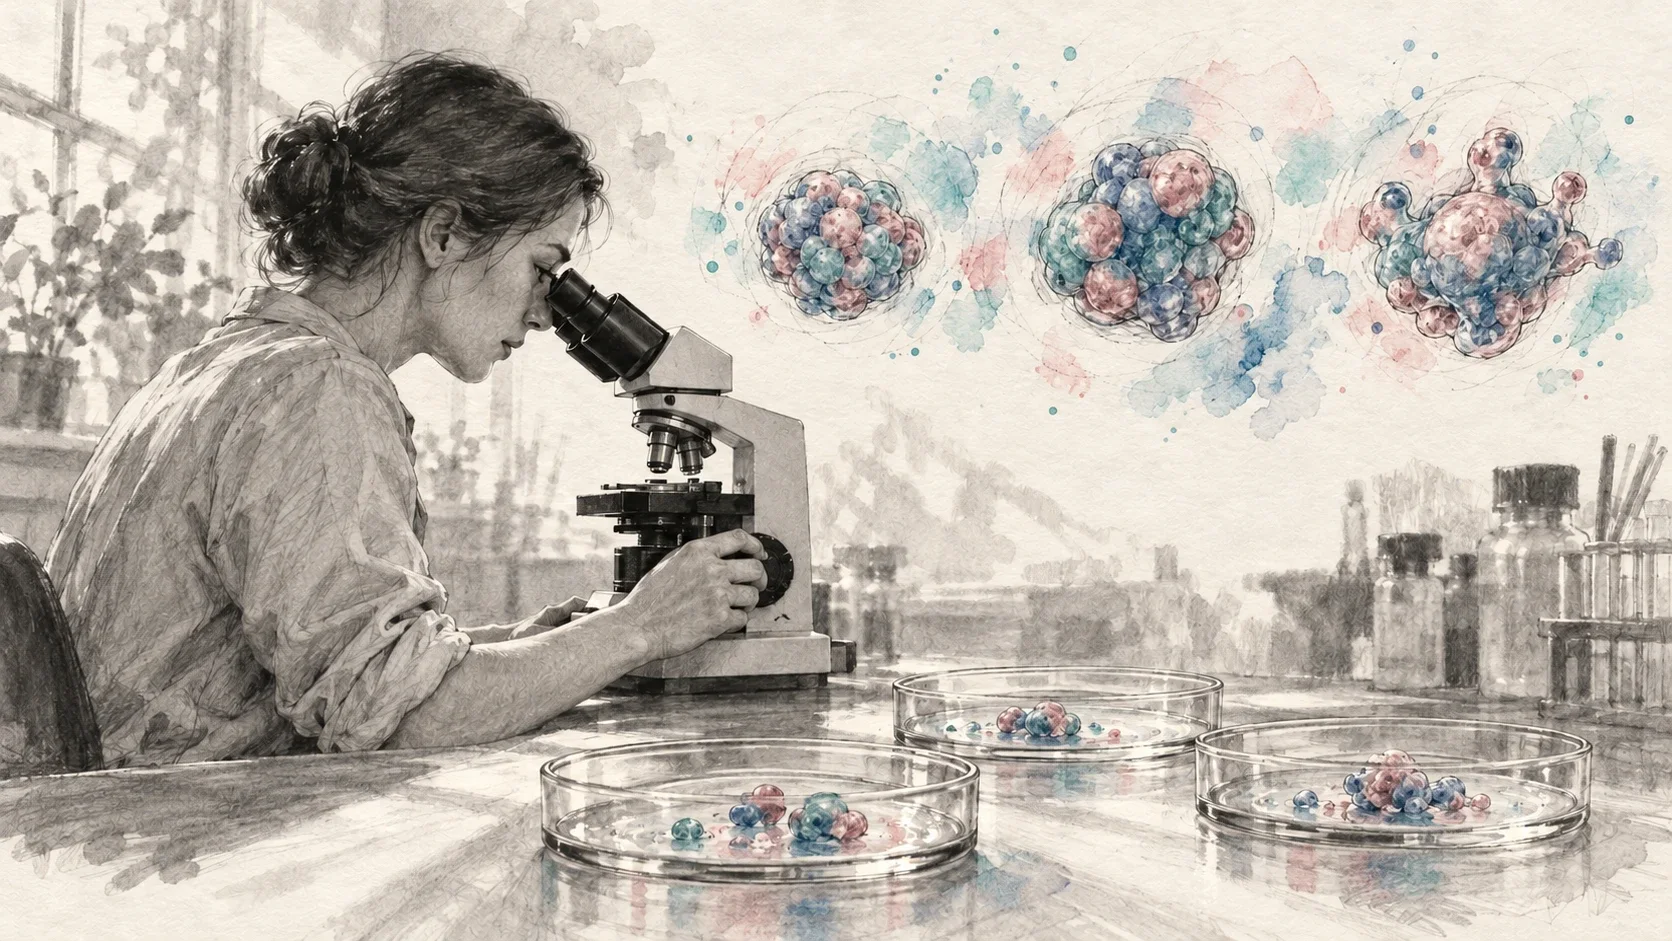
The organoid time-course has a protocol dated October 22, 2026, recorded in the white paper as preregistered and frozen. It covers normal, transitional, and carcinoma stages, with spectral measurements taken throughout. I am seeking laboratory collaboration to put that experiment on a bench.
If a measurement changes before conventional assessment flags the transition, that could make it useful for further investigation. Timing alone would not establish that the measured change causes cancer or corresponds to the mechanism studied by KAIST.
Connecting those levels would require matched biological evidence, ideally including molecular measurements from the same experimental system. Establishing causation would require controlled interventions.
The report also proposes a blinded, sham-controlled 30–60 Hz frequency sweep across four cell lines. That would test a separate question about responses to applied frequencies.
The frequency spectrum of a static image describes variation across space. It does not demonstrate a response to an applied frequency in hertz.
For these experiments, the measurements, controls, analysis choices, and criteria for success need to be fixed and documented before new outcomes are examined. Evaluation must also account for related images from the same patient, lesion, or slide.
A protocol becomes valuable when another team can examine exactly what was planned, what was done, and what happened.
The ask
The underlying datasets are public. Independent reproduction also requires the exact analysis code, dataset selections, preprocessing, and evaluation procedures.
If you run a cancer biology lab and want to discuss the transition time-course, write to me at [email protected].
If you want to challenge the analysis, I welcome scrutiny of the methods, provenance, and interpretation. Find the confounder. Check the calculation. Test whether the pattern holds when the conditions change.
The point of an audit is to expose what needs correcting and establish what can be reproduced.
I want to know whether these measurements can become a reliable way to follow changes in cellular organization—and whether that information can add something useful to the biological picture.
The goal is to make the pattern readable, then find out what it can reliably tell us.
Full report: “Coherence-Feature Analysis of Malignant Tissue: Verified Findings from Public Datasets,” dated October 3, 2026, with extensions through October 23. Numerical findings above are reported from that white paper; this article is not an independent rerun. Research prototype only—not a diagnostic device.
References
- Guarino, P. S. Coherence-Feature Analysis of Malignant Tissue: Verified Findings from Public Datasets. White paper, October 2026. Read it on this site.
- Shin, D., et al. “Attractor Landscape Analysis Reveals a Reversion Switch in the Transition of Colorectal Tumorigenesis.” Advanced Science 12(8), e2412503 (2025). Publication record. Full paper.
- Mairinger, T., Mikuz, G., and Gschwendtner, A. “Nuclear chromatin texture analysis of nonmalignant tissue can detect adjacent prostatic adenocarcinoma.” The Prostate 41(1), 12–19 (1999). Publication record.
- Mourya, S., et al. ALL Challenge dataset of ISBI 2019 (C-NMC 2019). Dataset documentation.
- Tschandl, P., Rosendahl, C., and Kittler, H. “The HAM10000 dataset, a large collection of multi-source dermatoscopic images of common pigmented skin lesions.” Scientific Data 5, 180161 (2018). Dataset paper.
- Veeling, B. S., et al. PatchCamelyon dataset documentation.